Business impact analysis: The complete guide to knowing exactly what breaks first
| Tempo di lettura:
Business disruptions no longer announce themselves politely. A ransomware attack locks your systems at 3 AM. A supplier goes dark overnight. A regulatory change drops with 30 days to comply. The organizations that survive these moments share one advantage: they’ve already mapped exactly what breaks when things go wrong.
Business Impact Analysis answers the question every executive should lose sleep over—what happens to revenue, operations, and reputation when critical functions fail? ISO 22301:2019 defines it as “the process of analyzing the impact over time of a disruption on the organization.” NIST SP 800-34 adds precision, framing BIA as correlating information systems with critical mission processes to characterize disruption consequences.
This isn’t theoretical preparation for unlikely scenarios. It’s the operational foundation that determines whether your organization responds to crisis with clarity or chaos.
What is business impact analysis (BIA)?
Business Impact Analysis systematically evaluates how disruptions cascade through your operations, quantifying the damage and establishing recovery priorities. The process identifies which functions keep your business alive, maps their dependencies on systems and people, and calculates exactly how much time you have before disruption becomes disaster.
Most organizations discover uncomfortable truths during their first BIA. That backup vendor you trust? Your procurement system depends on them, which feeds production planning, which drives customer delivery promises. When that vendor fails, you’re not managing one problem—you’re managing a chain reaction with escalating financial consequences at each link.
Core components of a BIA
A comprehensive BIA rests on three pillars: identifying critical business functions, assessing their dependencies, and quantifying potential impacts. The identification phase catalogs every process essential for delivering products or services. Dependency mapping reveals the support structures beneath each critical function, including IT systems, key personnel, third-party vendors, and physical resources.
Impact quantification moves beyond simple availability questions. It calculates financial losses per hour of downtime, operational degradation as disruption persists, regulatory exposure from compliance failures, and reputational damage that compounds over time. This quantification uses Recovery Time Objective (RTO), which defines maximum acceptable downtime for each function, and Recovery Point Objective (RPO), which establishes tolerable data loss.
The BIA process synthesizes stakeholder insights through interviews and questionnaires, capturing findings in reports that drive recovery strategy decisions and justify resilience investments.
BIA vs. risk assessment
Risk assessment and BIA examine organizational vulnerability from different angles. Risk assessment focuses forward, identifying potential threats and estimating their likelihood. It answers questions about probability and prevention—what scenarios might occur, how likely are they, and what controls reduce their chance of happening.
BIA assumes disruption has occurred and looks inward at consequences. It quantifies what happens when specific functions fail, regardless of cause. A risk assessment might identify cyberattacks as a high-probability threat requiring enhanced security controls. The BIA determines that a four-hour trading system outage costs millions in direct losses, whether that outage stems from cyberattack, hardware failure, or human error.
Organizations need both analyses to build resilience. Risk assessment informs prevention strategies. BIA establishes recovery priorities and validates whether current capabilities match survival demands.
BIA vs. business continuity planning
Business Continuity Planning (BCP) and BIA exist in a deliberate sequence, with BIA providing the intelligence that makes BCP actionable. The BIA phase identifies critical functions, quantifies impacts, and establishes recovery timelines. BCP takes these findings and designs the actual strategies, procedures, and resources needed to maintain or restore operations during disruption.
Consider the relationship as research informing action. BIA reveals that your payment processing system has a four-hour RTO because customer transactions generate $500,000 hourly and contractual SLAs trigger penalties at the six-hour mark. BCP then develops specific procedures for failover to backup systems, assigns execution roles, identifies alternative processing methods, and documents restoration sequences.
Why business impact analysis is critical in 2026
The business environment in 2026 presents a convergence of forces that make BIA essential for organizational survival. Global 2000 companies lost $400 billion annually to downtime in 2025, equating to 9% of their total profits. Escalating cyber threats combine with supply chain volatility, climate events, and geopolitical instability, creating compound risks that outdated resilience assumptions cannot address.
Financial impact quantification
Financial quantification transforms abstract concerns about disruption into specific dollar amounts that drive executive attention and resource allocation. Recent data reveals 98% of organizations reported single-hour downtime costs exceeding $100,000 in 2025, with 81% surpassing $300,000 per hour.
Average per-minute costs reached $14,056 for all organizations and $23,750 for large enterprises in 2025, representing a 150% rise from 2014 baselines. This dramatic escalation reflects increasing digital dependency across business operations.
Direct costs include lost revenue during downtime, overtime expenses for recovery efforts, and immediate penalties from service level breaches. Indirect costs accumulate through damaged customer relationships, delayed strategic initiatives, and diverted management attention. Ponemon Institute’s 2024 report found average global data breach costs at $4.88 million, up 10% from 2023, with security AI and automation saving $1.8 million per incident.
Organizations that can’t quantify these impacts struggle to compete for budget against initiatives with clear ROI projections. BIA converts business continuity from a compliance checkbox into a defendable investment case.
Industry-specific downtime economics
Downtime costs vary dramatically by sector, reflecting different operational models and customer expectations. Financial services face the steepest consequences, with costs ranging from $12,000 per minute to $9.3 million for major banks, amplified by regulatory fines.Manufacturing downtime averages $260,000 per hour, escalating to $500,000-$1 million during supply chain disruptions.
Automotive manufacturing faces particularly severe exposure, with production halts costing $2.3-$3 million daily at $50,000 per minute. Mid-size retail operations experience $200,000-$500,000 hourly losses, jumping to $1-2 million during e-commerce peak periods.
These sector-specific realities underscore why generic BIA approaches fail. Organizations must calibrate impact analysis to their operational context and competitive environment.
Regulatory compliance requirements
Regulatory environments continue evolving with new laws, updated standards, and heightened enforcement. Changes to data protection requirements, financial reporting obligations, and industry-specific mandates increase the compliance dimensions of disruption impacts. When systems fail, organizations face not just operational problems but potential regulatory violations with substantial penalties.
BIA assessment identifies which processes carry regulatory significance, what timelines apply for maintaining compliance during incidents, and where gaps exist between current recovery capabilities and regulatory obligations. Standards like ISO 27001 require documented understanding of business impacts as part of information security management. Compliance audits increasingly expect organizations to demonstrate how recovery priorities align with regulatory obligations, with BIA serving as primary evidence.
Technology dependency mapping
Technology infrastructure in 2026 has evolved into complex ecosystems of interconnected systems, cloud services, third-party platforms, and data flows. Each system introduction, vendor integration, or platform migration creates dependencies that may not be obvious until something breaks. Organizations that can’t map these dependencies face blind spots in continuity planning, discovering critical gaps only during actual incidents.
BIA technology mapping identifies which systems support each critical business function, reveals interdependencies between applications, and highlights single points of failure. This visibility extends beyond your organization to encompass vendor platforms, communication networks, and external services woven into daily operations.
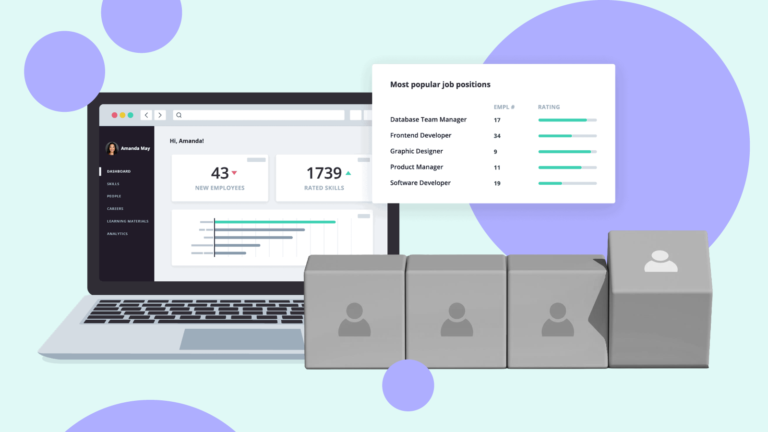
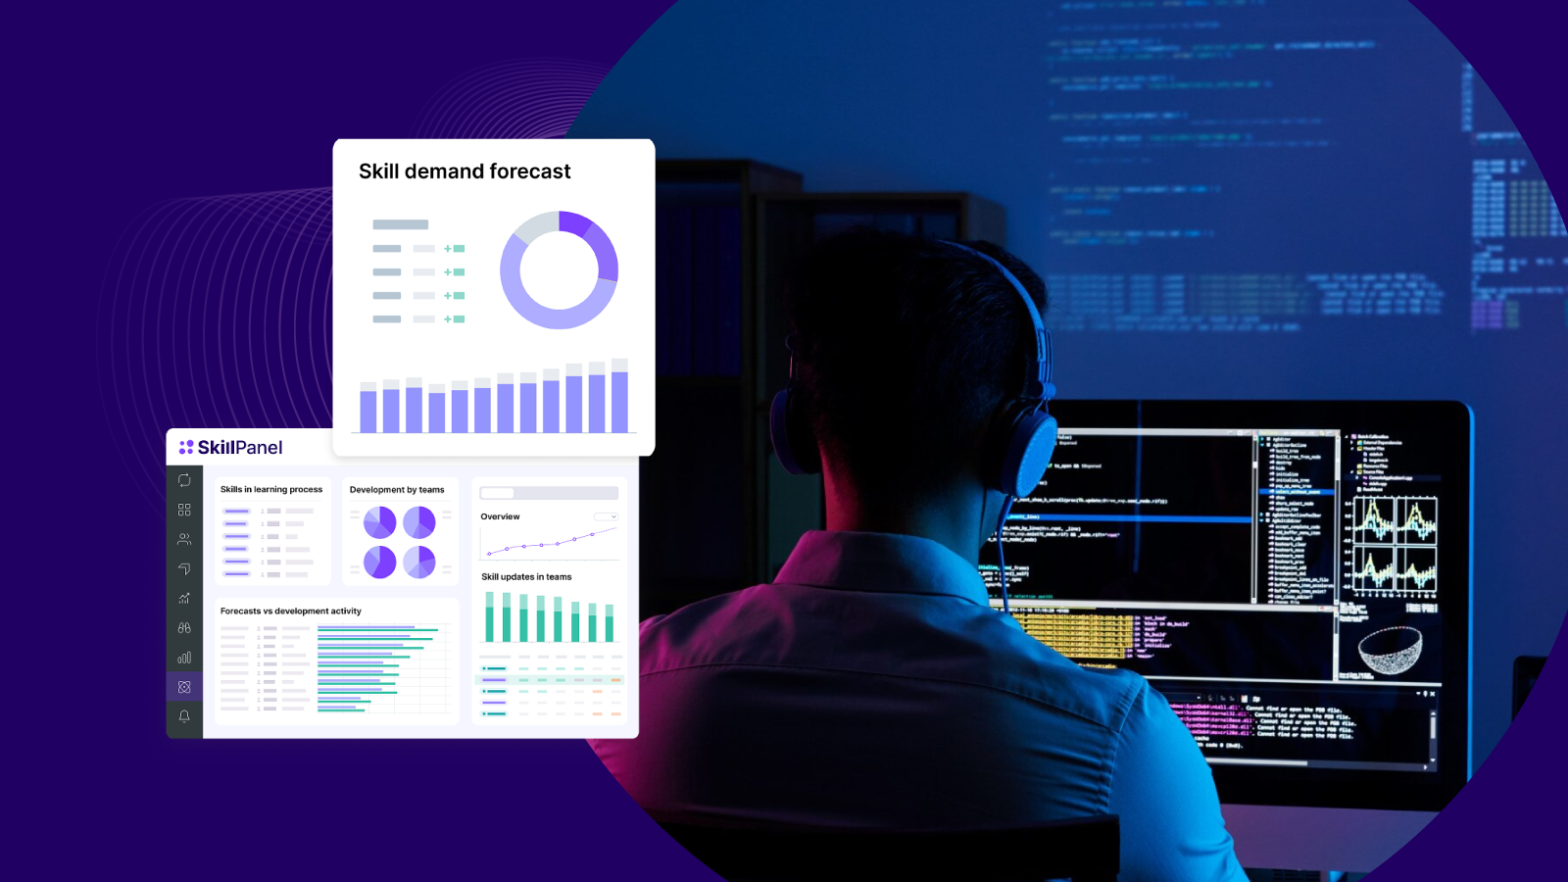
Workforce capabilities represent another dependency layer requiring systematic analysis. Skills mapping platforms can help assess whether recovery plans account for key personnel unavailability and whether organizations have sufficient bench strength to execute business continuity plans when key personnel are unavailable.
Emerging 2025-2026 disruption patterns
The disruption landscape has shifted significantly in recent years. Cockroach Labs’ 2025 survey of 1,000 executives showed 100% experienced outage revenue losses in the past year, with 84% losing at least $10,000 per outage and one-third experiencing losses between $100,000 and $1 million or more.
Recent high-profile incidents underscore these vulnerabilities. The CrowdStrike outage in July 2024 demonstrated how single-vendor dependencies can cascade across industries. The Change Healthcare breach in 2024 exposed healthcare sector vulnerabilities that disrupted patient care nationwide. These events shifted BIA from theoretical exercise to urgent operational necessity.
Stakeholder and customer trust
Trust operates as an intangible asset until crisis reveals its value. Customers, partners, and investors evaluate organizational resilience through how effectively you prepare for and respond to disruption. Organizations that conduct thorough BIA can communicate credibly about their resilience posture, explaining specific recovery capabilities based on analyzed impacts and tested procedures.
The reputational dimension extends beyond immediate incident response. Organizations that experience prolonged disruptions without clear communication face lasting skepticism about their reliability. BIA that incorporates reputational impact assessment helps prioritize recovery of customer-facing functions and informs communication strategies that maintain trust during difficult circumstances.
The 5 key areas of business impact analysis
Comprehensive BIA examines disruption effects across multiple dimensions, recognizing that failures rarely impact just one aspect of operations.
Financial impact
Financial impact analysis quantifies both immediate and cascading costs associated with business function disruption. Direct revenue loss from inability to process sales or deliver services represents the most visible impact. A retailer might lose $50,000 per hour of e-commerce platform downtime during peak shopping periods, while a SaaS provider faces subscription penalties and contract breach exposure.
Recovery efforts generate overtime labor costs, expedited shipping fees, temporary facility expenses, and consultant fees. Contractual penalties kick in when service level agreements are breached. Customer compensation for service disruptions adds further financial burden, as do costs for investigating root causes and implementing permanent fixes.
Long-term financial impacts prove harder to quantify but carry substantial weight. Customer churn accelerates when reliability questions arise, with lifetime value losses exceeding immediate incident costs. Delayed product launches create opportunity costs that compound over time.
Operational impact
Operational impact addresses the organization’s ability to execute essential business processes and deliver products or services. This dimension examines how function disruption cascades through operations, affecting upstream suppliers, downstream customers, and internal departments that depend on the disrupted process.
Production capacity represents obvious operational impact in manufacturing contexts. When assembly lines halt, the analysis tracks not just stopped output but also inventory buildup of components, workforce idle time, and schedule disruption for customer deliveries. Service organizations face different operational impacts—inability to respond to customer inquiries, delayed processing of applications, or suspended maintenance activities that create deferred problems.
Resource requirements for maintaining minimal operations during disruption reveal operational resilience gaps. Can you continue processing orders manually if the order management system fails? Do you have alternative communication channels when primary systems are unavailable?
Reputational impact
Reputational damage operates differently from other impact categories because it accumulates based on stakeholder perception rather than objective metrics. How customers, partners, media, and the public interpret your response shapes reputation more than the disruption itself. Organizations that manage incidents transparently with clear communication typically limit reputational damage, while those that appear unprepared face lasting credibility issues.
Customer trust erodes when disruptions expose operational fragility. A single extended outage can undo years of reliability messaging, particularly if competitors maintain operations during the same event. Social media amplifies reputational impacts by providing platforms for frustrated customers and creating permanent public records of how incidents unfolded.
BIA reputational analysis considers which business function disruptions carry highest visibility to external stakeholders. Payment processing failures affect every customer immediately. Back-office disruptions might be invisible to customers but critical for regulatory compliance, creating reputational risk through investigation or penalties.
Legal and regulatory impact
Legal and regulatory impacts encompass formal consequences when disruptions prevent compliance with laws, regulations, or contractual obligations. These impacts range from financial penalties and mandatory remediation to loss of operating licenses or criminal liability in severe cases.
Data protection breaches during system failures trigger regulatory investigation and potential fines under frameworks like GDPR or state privacy laws. Financial institutions face reporting requirements with specific timelines that don’t extend for operational issues. Healthcare providers must maintain patient care capabilities that meet regulatory standards even during facility or system disruptions.
Contractual obligations create another layer of legal exposure. Service level agreements specify uptime guarantees and penalty structures for breaches. BIA legal analysis identifies these obligations and establishes whether current recovery capabilities can meet contractual timelines.
Customer and stakeholder impact
Customer impact extends beyond financial or operational dimensions to encompass the human experience of disruption. How does system unavailability affect customers trying to accomplish urgent tasks? What alternatives exist when normal channels fail? How does communication during incidents shape customer perception?
Different customer segments experience impacts differently. Enterprise customers with their own dependencies on your services face cascading effects through their operations. Individual consumers may tolerate brief disruptions but have low patience for extended or repeated incidents.
Stakeholder impact encompasses partners, suppliers, and communities affected by your operational disruptions. Supply chain partners may need alternative fulfillment arrangements when your systems fail. Investors expect governance practices that include resilience planning.
How to conduct a business impact analysis: Step-by-step process
Effective BIA follows a structured methodology that ensures comprehensive coverage while managing scope and timeline. The process typically requires six to twelve weeks for completion, scaling with organizational complexity.
Step 1: Establish your BIA team and scope
BIA success begins with assembling the right team and defining clear boundaries. The team must include representatives who understand operational processes, possess organizational credibility, and can commit dedicated time. Cross-functional participation ensures comprehensive coverage and builds stakeholder buy-in essential for implementing findings.
Core team roles include a project lead who drives methodology and timeline, process owners who provide detailed operational knowledge, IT representatives who understand system dependencies, risk management professionals who connect to broader resilience programs, and executive sponsors who provide authority and resource access.
Scope definition establishes which business units, locations, processes, and systems fall within BIA coverage. Clear boundaries prevent scope creep that extends timelines and dilutes focus on priority functions. Defining objectives clarifies what the organization needs from BIA—whether IT disaster recovery planning, regulatory compliance requirements, or executive visibility into operational vulnerabilities.
Step 2: Identify critical business functions and processes
Identifying critical functions separates processes essential for organizational survival from those that support operations without being strictly necessary. This prioritization becomes crucial when recovery resources are limited and decisions about restoration sequence must be made quickly.
Several methods exist for categorizing function criticality. Revenue contribution analysis identifies processes that directly generate income or enable customer transactions. Regulatory requirement analysis highlights processes where failure creates immediate compliance violations. Strategic importance assessment considers processes that differentiate your organization competitively.
Stakeholder impact evaluation examines which processes, if disrupted, most seriously affect customer experience or partner relationships. Time sensitivity analysis identifies processes with narrow tolerance windows before impacts become severe. Combining these methods creates weighted scoring that ranks functions more reliably than single-dimension assessment.
Critical functions rarely operate in isolation. Mapping dependencies reveals the supporting infrastructure, systems, personnel, and vendor services required for each function. A customer order processing function might depend on the order management system, payment gateway, inventory database, fulfillment center operations, shipping carrier integrations, and customer communication platforms. This understanding proves essential for recovery planning and for identifying where redundancy investments deliver greatest resilience improvement.
Step 3: Gather information using BIA questionnaires
Structured data collection through questionnaires and interviews ensures consistent information across all analyzed functions. Well-designed questionnaires balance comprehensiveness with respondent burden, addressing function description and business purpose, systems and technology dependencies, key personnel and skills required, vendor relationships, regulatory requirements, and estimated impacts across financial, operational, reputational, and legal dimensions at various time intervals.
Impact timeline questions typically probe consequences at specific intervals—one hour, four hours, 24 hours, three days, one week, two weeks. This temporal dimension reveals how rapidly impacts escalate and informs priority decisions.
Interviews with process owners provide depth beyond questionnaire responses and enable clarification of complex dependencies. Effective interviews begin with explaining BIA purpose and how information will be used, reducing resistance from participants concerned about creating exposure for their areas. Interactive questioning techniques help overcome the challenge that process experts often have difficulty envisioning disruption scenarios. Walking through specific scenarios—”If this system was unavailable for 24 hours, how would your team work around it?”—generates more concrete estimates than abstract questions.
Step 4: Determine recovery time objectives (RTO) and recovery point objectives (RPO)
RTO and RPO establish temporal boundaries that define acceptable impact tolerance and drive recovery capability requirements. These metrics translate business impact understanding into specific technical and operational targets.
Maximum Tolerable Downtime (MTD) represents the absolute limit beyond which function disruption creates unacceptable consequences for organizational viability. MTD calculation considers the point where financial losses exceed recovery costs, regulatory violations occur, customer relationships suffer irreparable damage, or competitive position erodes beyond repair.
For revenue-generating functions, MTD often aligns with when cumulative losses or penalties exceed a threshold threatening organizational solvency. For compliance functions, MTD may be dictated by regulatory reporting deadlines or legal obligations.
RTO must fit realistically within MTD while accounting for practical constraints on recovery speed. Organizations commonly discover that desired RTOs exceed what current systems, processes, and resources can deliver. This gap identification drives investment decisions about enhanced capabilities or acceptance of higher risk.
RPO establishes how much data loss the organization can tolerate, typically expressed as a time interval. An RPO of four hours means the organization accepts potential loss of up to four hours of data updates if disaster strikes. Critical financial transactions might require near-zero RPO through real-time replication, while historical reporting data might tolerate 24-hour RPO with daily backup.
Step 5: Assess financial and operational impacts
Impact assessment translates qualitative understanding of function importance into quantitative measures that drive priority decisions and resource allocation.
Direct financial impacts include revenue loss during downtime, calculated by understanding transaction volumes and average values. An e-commerce platform processing $100,000 in hourly transactions faces easily calculated direct losses. Service providers must account for subscription penalties, contract breaches, and potential customer terminations.
Indirect costs prove harder to quantify but often exceed direct impacts. Recovery labor costs accumulate through overtime, contractor fees, and diverted personnel. Expediting costs arise from rush shipments, temporary facilities, or emergency vendor services. Regulatory investigation costs include legal fees, remediation expenses, and potential fines.
Resource analysis identifies what’s needed to maintain minimum operations during disruption or to restore full capability. Personnel requirements include specialized skills that might be in short supply, particularly for recovery procedures executed infrequently. This analysis often reveals that planned recovery strategies require resources you don’t currently have, allowing time to develop capabilities through training, hiring, or vendor relationships before disruption occurs.
Step 6: Analyze data and identify gaps
Analysis synthesizes collected information to reveal patterns, prioritize functions, and identify where current capabilities fall short of requirements. Comparing RTOs established through impact assessment against actual recovery capabilities highlights gaps requiring attention.
Priority ranking emerges from combining impact severity, time sensitivity, and regulatory requirements. Functions with severe financial impacts, short MTD, and regulatory significance rank highest for recovery priority. This ranking guides resource allocation decisions and informs recovery sequence planning.
Gap analysis examines current state versus required state across multiple dimensions. Do backup systems exist for critical applications? Can they be activated within RTO targets? Are recovery procedures documented and tested? Do personnel know their roles in recovery efforts?
Step 7: Document findings in a BIA report
Comprehensive documentation translates BIA insights into a reference that drives recovery planning, justifies investments, and provides audit evidence. The report must serve multiple audiences with different needs, from executive decision-makers to operational teams implementing recovery procedures.
Executive summaries distill BIA findings into business terms that enable leadership decisions, identifying highest priority functions and their recovery requirements, quantifying financial exposure from disruptions, highlighting critical gaps between current capabilities and requirements, and recommending priority investments for resilience improvement.
Effective executive summaries avoid technical jargon and connect findings to business outcomes. Instead of listing system RTOs, they explain that payment processing recovery capability needs improvement because current four-hour RTO exceeds the two-hour threshold where customer impacts become severe and contractual penalties trigger.
Detailed function analysis provides supporting evidence for executive recommendations, including business purpose and value, dependencies on systems and personnel, impact escalation timeline with financial and operational consequences, current recovery capability and gaps, and recommended RTO and RPO targets.
Visual representation of how impacts escalate over time communicates urgency more effectively than narrative descriptions. Timeline projections show the sequence of consequences from initial disruption through catastrophic failure, helping stakeholders understand why rapid response capabilities matter.
Recommendations translate identified gaps into actionable initiatives, including specific capability improvements needed, estimated implementation cost and timeline, expected risk reduction benefit, and priority ranking. Connecting recommendations back to quantified impacts helps justify investments. When you can demonstrate that a $200,000 redundancy investment prevents multi-million-dollar exposure, the business case becomes clear.
Business impact analysis templates and tools
Standardized templates accelerate BIA execution while ensuring comprehensive coverage. Tools range from simple spreadsheets to sophisticated platforms that integrate with broader risk management programs.
Basic BIA templates provide starting points for organizations beginning their first analysis, including function inventory worksheets, impact assessment questionnaires, RTO and RPO calculation tools, and findings documentation formats. Free templates work effectively for smaller organizations or focused BIA projects but require more manual effort for data consolidation and analysis compared to integrated software solutions.
Dedicated BIA software platforms automate data collection through web-based questionnaires, centralize responses in searchable databases, generate impact reports and visualizations, integrate with broader risk and compliance management systems, and track BIA updates and review cycles over time.
Industry-specific adaptations address unique requirements and regulatory contexts of different sectors. Healthcare BIA templates emphasize patient safety impacts and HIPAA compliance requirements. Financial services templates focus on transaction processing capabilities and regulatory reporting obligations. Manufacturing templates address supply chain dependencies and production continuity. Customization also reflects organizational culture and communication preferences.
Real-world business impact analysis examples
Examining how organizations apply BIA reveals practical insights beyond theoretical frameworks.
Healthcare consulting firm: ISO 27001 compliance through BIA
KJT Group, an evidence-based consulting firm serving pharmaceutical, biotech, medical device manufacturers, and health insurers, conducted a comprehensive BIA around 2023 to meet ISO 27001 compliance requirements, develop a disaster recovery strategy, and assess cloud migration readiness on AWS.
The firm faced an evolving threat landscape, new ISO 27001 requirements mandating BIA, and shortcomings in AWS security that necessitated analysis of datacenter architecture, Active Directory, network infrastructure, client services, IT processes, and network administration. Through strategic planning sessions, KJT established specific RTOs and RPOs for applications, systems, networks, and assets.
The BIA improved cybersecurity posture, achieved ISO 27001 compliance, and created a prioritized roadmap addressing disaster recovery gaps, operational and financial impacts, data and application inventory, and technical gaps. This enabled a strategic cloud migration approach rather than reactive technology decisions. The key lesson: integrating BIA with compliance initiatives creates dual value by meeting regulatory requirements while strengthening operational resilience. Organizations pursuing ISO 27001 or similar certifications should view BIA as strategic opportunity rather than compliance burden.
Financial services: Quantifying trading system criticality
A Fortune 500 financial services company performed a comprehensive BIA in 2024 that proved prescient months later. The analysis revealed that a four-hour trading system outage would generate substantial direct losses plus regulatory penalties and customer compensation costs. This precision enabled prioritized mitigation investments that would have been impossible to justify with general statements about “significant financial risk.”
The BIA established a two-hour RTO for the trading platform based on the escalating impact timeline. This drove investment in hot-standby infrastructure that enabled recovery within 90 minutes when sophisticated ransomware later targeted their systems. Without BIA quantification of financial exposure, the organization would likely have maintained lower-cost backup solutions with four-hour recovery capability, resulting in millions more in losses.
The challenge encountered during implementation centered on gathering accurate impact data from trading desk personnel who initially struggled to estimate hourly loss rates across different market conditions. The solution involved analyzing historical transaction data and modeling various disruption scenarios during different trading volumes. This data-driven approach produced defendable estimates that executive leadership accepted.
Manufacturing: Supply chain vulnerability discovery
A major automotive manufacturer’s BIA revealed critical single-source dependencies across 14 vehicle models. The analysis mapped dependencies throughout the supply chain, identifying concentration risk in specialized component suppliers. When the analysis showed how single supplier failure could halt production with cascading effects, it prompted immediate supply chain diversification initiatives.
Findings drove investments to distribute risk across multiple suppliers for critical components. When regional flooding later impacted the originally identified single-source supplier, alternative suppliers activated by the mitigation strategy prevented production disruption entirely. The manufacturer estimated that BIA-informed supply chain investments saved over $50 million in losses that would have occurred under the original vulnerable configuration.
The key implementation challenge involved convincing procurement leadership that supplier diversification warranted the increased complexity and slightly higher component costs. The BIA’s quantification of potential production halt impacts—linked to specific vehicle models and market commitments—provided the business case that shifted the cost-benefit analysis. The lesson: detailed financial modeling of disruption scenarios overcomes resistance to resilience investments that appear expensive until compared against exposure.
Emerging BIA considerations for 2025-2026
The disruption landscape continues evolving, requiring organizations to expand traditional BIA frameworks to address new vulnerability patterns.
AI and machine learning system dependencies
Heavy reliance on AI and ML for augmented analytics and decision intelligence creates new risks from improper cross-border GenAI use, with over 40% of AI-related data breaches projected by 2027. Organizations must now assess how AI-powered business processes change impact analysis, including dependencies on AI platforms, data quality requirements for model accuracy, and governance frameworks for AI decision-making.
BIA questionnaires should now probe which business functions depend on AI systems, what happens when AI services become unavailable, whether manual alternatives exist for AI-driven processes, and how quickly the organization can shift to non-AI workflows. The challenge intensifies as GenAI spending approaches $644 billion by 2025, pulling critical business processes into AI-dependent architectures.
Cloud service provider concentration risk
Cloud BI comprises 66% of the market in 2024 and growing, easing integration but raising compliance, governance, and security concerns for sensitive data migration. Organizations must map multi-cloud dependencies, assess vendor lock-in risks, and establish recovery procedures when cloud providers experience outages.
Recent incidents demonstrate the vulnerability. The CrowdStrike outage in July 2024 showed how single-vendor dependencies cascade across industries. BIA analysis must now identify which business functions depend on specific cloud providers, what happens during provider outages, whether multi-cloud architectures provide meaningful redundancy, and how quickly workloads can shift between providers.
Hybrid work model implications
Broader user bases across finance, operations, and field teams in hybrid environments widen scale gaps, with unlimited access replacing per-user licensing but demanding policy-aware access to prevent inconsistent insights and governance lapses. BIA must now assess workforce dispersion impacts on business continuity.
Questions to address include whether critical functions can be executed from distributed locations, what happens when physical facilities become unavailable, whether remote workforce capabilities match recovery requirements, and how communication occurs when teams aren’t co-located. The shift to hybrid models has fundamentally changed workforce availability assumptions that underpin traditional recovery strategies.
Supply chain vulnerability escalation
Fragmented data pipelines and third-party integrations create poor data quality as a leading barrier, with pipelines failing and schemas changing unexpectedly in cloud-native BI. Supply chain vulnerabilities extend beyond physical goods to encompass data ecosystems, API dependencies, and integration platforms.
BIA analysis must map which third-party services support critical functions, what alternatives exist when vendors fail, how quickly new vendor relationships can be established, and whether data portability enables provider switching. The interconnected nature of modern supply chains means single-point failures cascade unpredictably.
Cybersecurity threat evolution
AI-enhanced analytics and real-time processing heighten breach risks via ungoverned self-service, anomaly detection flaws, and lacking AI observability. By 2027, governance shortfalls in synthetic data will amplify compliance threats. BIA must now incorporate cyber resilience dimensions that extend beyond traditional disaster recovery.
Organizations should assess which business functions are most vulnerable to ransomware or data breaches, how quickly systems can be restored from clean backups, whether incident response procedures align with RTO targets, and how cyber insurance coverage maps to quantified impacts. The Change Healthcare breach in 2024 demonstrated how cyberattacks can disrupt healthcare delivery nationwide, illustrating the sector-spanning implications of modern cyber threats.
Common BIA challenges and how to overcome them
Organizations consistently encounter similar obstacles during BIA execution. Recognizing these challenges enables proactive mitigation.
Securing stakeholder buy-in
Stakeholder resistance stems from perception that BIA creates additional work without clear benefit or fear that analysis will expose vulnerabilities. Process owners may hesitate to estimate impacts, particularly financial consequences, without perfect information.
Overcoming resistance requires early communication about BIA purpose and benefits, emphasizing that the goal is organizational resilience, not fault-finding. Executive sponsorship demonstrates leadership commitment and provides authority to request stakeholder participation. Sharing preliminary findings that reveal previously unrecognized dependencies or risks can build appreciation for analysis value. Reducing participation burden through efficient questionnaires and focused interviews shows respect for stakeholder time.
Data collection obstacles
Estimating impacts requires process owners to envision scenarios they’ve never experienced, making accuracy difficult. Organizations often lack baseline data about transaction volumes, cost structures, or resource dependencies necessary for quantification.
Structured approaches help overcome estimation challenges. Scenario-based questioning—walking through specific disruption examples—generates more concrete responses than abstract impact questions. Historical incident data from your organization or industry peers provides reference points. Breaking large impact questions into smaller components makes estimation more manageable. Accepting ranges rather than precise figures acknowledges estimation uncertainty while still enabling prioritization. Knowing a function causes between $50,000 and $100,000 hourly impact provides sufficient information to rank it relative to functions with $5,000 or $500,000 impacts.
Keeping your BIA current
Business environments evolve continuously through system changes, process improvements, organizational restructuring, and new vendor relationships. BIA conducted today reflects current state, but that state shifts toward obsolescence as change occurs.
Annual reviews maintain BIA relevance, updating critical function lists, revising impact estimates based on business growth, capturing new dependencies from system implementations, and incorporating lessons from incidents or near-misses. Trigger-based updates supplement annual reviews by prompting analysis when significant changes occur, such as major system implementations, acquisitions or divestitures, regulatory changes, and organizational restructuring. Regular reviews can reduce recovery costs by up to 30 percent by ensuring strategies remain aligned with current operations.
Integrating your BIA with disaster recovery and business continuity plans
BIA delivers maximum value when integrated into broader resilience programs rather than treated as standalone analysis.
BIA findings translate directly into business continuity strategy by establishing recovery priorities, resource allocation decisions, and capability targets. Functions identified as most critical with shortest tolerable downtime receive priority for redundancy investments and recovery procedure development. Continuity strategies address identified gaps through technical redundancy, process alternatives that enable manual workarounds, resource stockpiling, and vendor agreements establishing emergency support channels.
Disaster recovery planning converts BIA priorities into executable procedures for restoring systems and operations. RTO and RPO targets established through BIA become design requirements for backup infrastructure, data replication, and recovery processes. Recovery sequencing follows BIA function prioritization, with systems supporting the most critical functions restored first.
Continuity and recovery plans untested against BIA scenarios often fail when real incidents occur. Regular testing validates that RTOs are achievable, procedures are current and executable, personnel know their roles, and vendors can deliver committed support. Testing approaches range from tabletop exercises that walk through scenarios to full failover tests that activate backup systems. Test frequency should align with function criticality, with most critical capabilities tested more frequently.
Next steps: Implementing your business impact analysis
Completing BIA represents a beginning rather than an end point. Value emerges from actions taken based on findings.
Implementation roadmaps prioritize gap remediation and capability improvements identified through BIA, considering impact severity of the function at risk, gap size between current and required capability, implementation cost and timeline, and dependencies where addressing one gap enables other improvements.
Quick wins that address significant gaps with modest investment often lead roadmaps to build momentum and demonstrate value. These might include documenting recovery procedures for critical processes, conducting initial testing of backup systems, or establishing vendor agreements for emergency support. Long-term initiatives address structural gaps requiring substantial investment or organizational change, such as major infrastructure redundancy projects, business process redesign for resilience, and comprehensive workforce capability development.
Professional consultants bring experience across multiple organizations and industries, accelerating BIA execution and enhancing rigor. Organizations should consider consulting support when conducting their first comprehensive BIA, addressing complex environments with numerous interdependencies, facing compliance requirements with specific BIA standards, or lacking internal resources with requisite expertise. Consultants provide methodology frameworks proven across diverse contexts, facilitate stakeholder engagement with neutral third-party perspective, offer industry benchmarking for impact estimates and recovery targets, and deliver documentation meeting regulatory or audit standards.
Frequently asked questions about business impact analysis
What is the difference between BIA and risk assessment? BIA focuses on the consequences of disruptions to business processes, quantifying impacts and establishing recovery priorities. Risk assessment identifies potential threats and their likelihood of occurring. Both are essential components of resilience planning, with risk assessment informing prevention strategies and BIA driving recovery preparation.
How long does it take to complete a business impact analysis? Most organizations complete comprehensive BIA in six to twelve weeks, depending on organizational complexity and scope. Focused BIA covering specific business areas can be accomplished more quickly. The timeline includes team formation, data collection through questionnaires and interviews, analysis and prioritization, and report documentation.
What is the role of BIA within business continuity management? BIA plays a crucial role in the functional requirements phase of business continuity management. It identifies critical functions and their recovery priorities, establishing the foundation upon which continuity strategies and disaster recovery plans are built. Without rigorous BIA, continuity plans risk protecting the wrong things or setting unrealistic expectations.
How often should we update our business impact analysis? Annual reviews maintain BIA relevance in evolving business environments. Additional updates should occur when significant changes happen, including major system implementations, organizational restructuring, regulatory changes, or after incidents that reveal gaps in understanding. Regular updates reduce recovery costs by ensuring strategies align with current operations.
What metrics should BIA establish? Key metrics include Recovery Time Objective (RTO) defining maximum acceptable downtime, Recovery Point Objective (RPO) establishing acceptable data loss, and Maximum Tolerable Downtime (MTD) representing the point where disruption threatens organizational viability. Additional metrics quantify financial, operational, reputational, and regulatory impacts at various time intervals.
Which factor is most essential when performing a BIA? Impact severity on time-sensitive operations represents the most essential factor. Understanding which processes have the narrowest tolerance for disruption and the most severe consequences enables effective prioritization of recovery efforts and resource allocation.
How do we ensure accurate data from stakeholders? Conducting interactive interviews with clarifying questions provides the best approach for obtaining reliable data. Scenario-based questioning helps stakeholders envision disruptions concretely rather than abstractly. Accepting ranges acknowledges estimation uncertainty while still enabling prioritization decisions.
Business Impact Analysis transforms abstract concerns about disruption into specific knowledge that drives resilient organizations. The process demands investment of time and attention, but the alternative—discovering your vulnerabilities during actual crisis—carries far greater cost. Organizations that systematically understand what breaks, when it matters, and what recovery demands find themselves prepared to turn potential disasters into manageable incidents.