What workforce exposure metrics are revealing about business vulnerability
| Tiempo de lectura:
This article was produced by the SkillPanel team. Where we reference our own platform, we’ve indicated it clearly.
Workforce exposure metrics have moved from academic research into the center of strategic business planning. As AI capabilities accelerate, organizations face a pressing challenge: understanding not just which jobs could be affected by automation, but how, to what degree, and what to actually do about it. The data emerging in 2026 paints a more nuanced picture than most headlines suggest, one where job market risk varies dramatically by task structure, adaptive capacity, and geography rather than simply by job title or industry. This analysis synthesizes research published through Q2 2026, including the ILO’s 2025 Global Index, IMF’s January 2026 report, and Anthropic’s 2025 labor market study.
What workforce exposure metrics actually measure (and what they don’t)
Before diving into specific numbers, it’s worth being precise about what these tools actually capture. Workforce exposure metrics are not fortune-tellers. They measure the degree to which AI systems can perform tasks that currently belong to human workers, but they don’t automatically predict job loss. That distinction is fundamental to using this data well.
The difference between AI exposure, displacement risk, and automation probability
These three concepts are often treated as interchangeable, but conflating them leads to poor decisions. AI exposure quantifies the potential impact of AI on specific tasks within a role, often expressed as a score derived from task taxonomies like O*NET. A high score means AI could plausibly handle many of those tasks, but it doesn’t mean the job disappears. The ILO’s framework, for instance, notes that many exposed roles see augmentation rather than replacement.
Displacement risk layers in real-world factors such as complementarity, meaning whether AI augments or replaces human effort, along with economic incentives and workforce preparedness. The IMF’s 2024 analysis estimates that nearly 40% of global employment faces meaningful AI exposure, rising to 60% in advanced economies, but only half of those exposed jobs in advanced economies face genuinely negative outcomes based on worker preparedness. Automation probability, on the other hand, specifically predicts full task or occupational replacement. OECD research using skills-based measures estimates around 27% of employment across surveyed countries falls into high-risk automation territory.
Why traditional labor metrics miss the full picture of human-AI work
Conventional workforce analytics were designed for a different era. Most rely on static snapshots: workforce planning reports, periodic skills surveys, manager-led interpretation of performance data. These approaches capture where the workforce is today but offer little insight into where vulnerabilities are building or how quickly roles might shift. Organizations using traditional methods often have no clear visibility into which roles are most exposed to AI impact, lacking the frameworks needed to identify role risk or make timely decisions around upskilling, support, or redeployment.
The deeper problem is that traditional metrics aggregate at occupational levels, smoothing over critical variation between individual workers doing nominally the same job. Someone classified as an “administrative assistant” in two different organizations may have very different skill profiles, task distributions, and adaptive capacities. Occupation-level measures lose that precision.
Key frameworks in use today: AI exposure index, job-exposure matrix, and automation exposure scores
Three primary frameworks currently dominate research and practice. The AI exposure index, as developed by the ILO’s 2025 Global Index, derives task-level automation potential scores from 29,753 individual tasks mapped to the ISCO-08 occupational taxonomy. These scores incorporate human surveys, expert validation, and AI model predictions, then aggregate into four exposure gradients based on mean exposure and task variability within each occupation.
The job-exposure matrix approach, analogous to frameworks used by the OECD and IMF, maps occupations to AI exposure through task taxonomies and distinguishes augmentation from displacement through a complementarity dimension. This structure is particularly useful for cross-country comparisons and policy analysis. Automation exposure scores, notably developed by Eloundou et al. and extended through 2025 and 2026, use GPT-4 assessments of O*NET tasks for standard occupational classifications, focusing specifically on generative AI productivity gains. A Yale Budget Lab 2026 analysis spanning seven different metrics found these frameworks largely converge on identifying clerical, administrative, and content-creation work as highest-exposure domains.
How researchers quantify AI’s impact on jobs in 2026
The methodological conversation in 2026 has matured significantly. Researchers are no longer debating whether to measure AI’s impact on jobs but rather which units of analysis and which data sources produce the most actionable insights. The consensus is increasingly clear: task-level analysis, combined with observed real-world usage data, outperforms cruder occupation-level forecasting.
Task-level vs. occupation-level analysis: Why granularity matters
Task-level analysis evaluates AI’s feasibility for each individual activity within a role rather than treating the job as a monolithic unit. This approach, which now dominates publications from MIT, Anthropic, BLS, and IMF, reveals something important: most jobs affected by AI face partial rather than wholesale automation. Researchers estimate AI will be capable of automating or augmenting 34 to 49% of tasks across affected occupations by 2030, allowing workers to shift energy toward activities that require critical thinking, judgment, and relationship management.
Occupation-level analysis offers a different but complementary view. BLS projections link higher AI exposure at the occupational level to slower projected growth, with roles like computer programming facing headwinds even as software developers overall are projected to grow at 17.9% compared to a 4.0% average. The limitation at this level of analysis is that it masks significant variation within occupational categories and tends to show limited broad displacement evidence, with hiring slowdowns concentrated mainly among younger workers entering exposed fields.
The role of adaptive capacity alongside raw exposure scores
Exposure score alone is an incomplete risk signal. What researchers increasingly find is that the same level of AI exposure produces very different outcomes depending on a worker’s adaptive capacity, defined by factors like liquid savings, age, skill transferability, and access to dense local job markets. A highly exposed professional with strong financial reserves, transferable skills, and a large urban labor market nearby faces a fundamentally different risk profile than a clerical worker in a small regional town with low savings and few adjacent roles available.
Anthropic’s 2025 observed exposure measure addresses a related dimension of this problem by combining theoretical task feasibility with empirical AI usage data, weighting automated, work-related patterns more heavily. Occupations scoring 10 percentage points higher on this observed exposure measure show 0.6 percentage point lower BLS-projected growth through 2034, a meaningful relationship that theoretical measures alone failed to capture. This approach also reveals that actual AI task coverage in the real world remains far below theoretical potential, due to model limitations, legal constraints, and slow technology diffusion across industries.
Data sources powering current exposure measures: O*NET, BLS, and proprietary indexes
O*NET remains the backbone of most exposure measurement work, providing detailed task taxonomies for hundreds of occupations that researchers can systematically evaluate against AI capabilities. The BLS occupational projections add an empirical grounding layer, linking observed hiring trends to exposure measures. Proprietary indexes, including those built from enterprise usage data and AI platform analytics, increasingly supplement these public sources to narrow the gap between theoretical exposure and actual deployment patterns. The most reliable exposure measurement frameworks today combine all three, cross-validating task-level scores against observed hiring data and real-world AI usage patterns to improve predictive accuracy.
What the 2026 data reveals about AI job displacement
With frameworks and methodologies in place, the 2026 picture on AI job displacement comes into clearer focus. The numbers are significant but nuanced, and the narrative they tell resists both alarmist and dismissive readings.
Which occupations carry the highest exposure scores
Administrative support occupations carry the highest AI exposure scores among major U.S. occupation groups, with scores in the 0.525 to 0.526 range, and they pair this high exposure with notably low adaptive capacity scores of 0.360 to 0.372. This combination is what makes these roles a focal point for concern. Professional and managerial occupations, representing 56.9 million workers, also face substantial AI exposure at 0.400 to 0.421, but their significantly higher adaptive capacity scores of around 0.734 buffer the overall risk. The jobs most at risk from AI are not necessarily the ones doing the most technically complex work. Higher-income roles requiring post-secondary education, particularly in knowledge work and analytical processing, show the highest exposure, which directly contradicts the long-standing assumption that white-collar work is inherently safer.
Industry patterns: Where AI impact is concentrated vs. broadly distributed
AI impact on labor markets is not evenly spread. Finance, technology, and professional services show concentrated exposure, where a large share of core tasks fall within AI’s growing capability range. Healthcare administration, legal support, and business analytics sit in similar territory. Other industries experience more diffuse exposure, where AI touches some tasks within many roles but rarely dominates an entire function. The WEF Future of Jobs Report 2025 projects 92 million roles displaced globally by 2030, offset by 170 million new roles for a net gain of 78 million positions. But those net gains don’t automatically reach displaced workers, and the mismatch between where job losses occur and where new roles emerge is a persistent structural challenge.
The ‘automation surprise’ blind spot: Jobs that look safe but aren’t
One of the more striking findings from 2026 research is how poorly intuition aligns with measured exposure on many roles. Mid-skill knowledge jobs, particularly in administrative coordination, scheduling, document processing, and data entry, score far higher on exposure measures than their salaries or educational requirements might suggest. Meanwhile, some physically demanding or geographically distributed roles score lower than expected. The AI and employment research community calls this the “automation surprise” pattern, where the practical automating power of generative AI reaches into cognitive domains that previous automation waves did not. Goldman Sachs Research estimates AI exposes 300 million global jobs, projecting 6 to 7% U.S. worker displacement over 10 years.
AI job displacement statistics: Separating signal from noise
The AI job displacement statistics circulating in 2026 require careful interpretation. The WEF’s finding that 41% of employers plan workforce reductions in AI-automatable areas within five years is significant, but it reflects intention rather than outcome. The IMF’s 2026 report shows employment in AI-exposed occupations is 3.6% lower after five years in high AI-skill demand regions, hitting entry-level roles particularly hard. What the aggregate data does not show is broad, immediate unemployment spikes. What it does show is slower hiring, reduced entry pathways for young workers, and a structural compression of certain role categories. Research tracking Current Population Survey data finds no widespread unemployment surge but does document a 14% drop in job-finding rates for workers aged 22 to 25 in highly exposed occupations following the widespread availability of generative AI tools.
The vulnerability gap: High exposure + low adaptive capacity
If there is a single concept that reshapes how organizations and policymakers should be reading exposure data, it’s the vulnerability gap. High exposure combined with limited adaptive capacity creates a qualitatively different risk profile, one that aggregate metrics consistently underreport.
Why exposure scores alone don’t identify the workers most at risk
Of the 37.1 million U.S. workers sitting in the top AI exposure quartile, roughly 26.5 million, or 70%, have above-median adaptive capacity. They have financial buffers, transferable skills, and access to robust local labor markets. High exposure for these workers is a transition challenge, not a crisis. The genuine vulnerability is concentrated in the remaining group, workers who combine high exposure with low adaptive capacity across all four key dimensions: liquid savings, age, labor market density, and skill transferability. Relying on exposure scores alone will misidentify risk in the wrong places and misallocate support resources.
Closing this gap requires moving beyond occupational averages to individual-level assessment that pairs role exposure with each worker’s actual adaptive profile. Skills intelligence platforms that assess readiness across capabilities, perception, and willingness alongside role-level AI risk can surface those distinctions at scale, generating targeted workforce transformation paths rather than generic planning reports.
Occupational and demographic profiles of high-vulnerability workers
The Brookings Institution analysis identifies 6.1 million U.S. workers, representing 4.2% of the workforce, as sitting in this high-exposure, low-adaptive-capacity intersection. The occupational profile is specific: approximately 2.5 million office clerks, 1.7 million administrative assistants and secretaries, 965,000 receptionists, and 831,000 medical secretaries. Demographically, 86% of these vulnerable workers are women concentrated in office and administrative roles. The work these roles involve, including scheduling, data entry, document handling, and routine correspondence, directly matches what large language models and AI automation tools now perform reliably. These workers are not at risk because their jobs are low-value. They face risk because their work happens to align closely with what generative AI does best.
Geographic concentration of at-risk roles across U.S. regions
The geography of AI job displacement risk adds another layer that national statistics flatten. The Brookings data identifies elevated shares of high-exposure, low-adaptive-capacity workers ranging from 2.4% to 6.9% in smaller metros and college towns, places like Laramie, Wyoming; Huntsville, Texas; Stillwater, Oklahoma; Springfield, Illinois; and Carson City, Nevada. These communities often have high concentrations of government and administrative employment alongside shallow local labor markets, meaning displaced workers have fewer adjacent opportunities and less economic resilience. Major tech hubs like San Jose, by contrast, show far lower concentrations despite high aggregate AI exposure, because adaptive capacity in those markets is substantially higher.
Limitations of current workforce exposure metrics
Any honest assessment of exposure measurement requires acknowledging what current metrics get wrong or simply can’t see. This is not a reason to dismiss the data, but it is a reason to use it carefully.
What occupation-level measures can’t capture
The aggregation problem runs deep. When researchers roll up task-level scores to occupational averages, they lose the within-occupation variance that often determines actual worker experience. Two workers in the same classified occupation may have radically different task compositions based on their employer’s processes, their individual specializations, or the specific software environments they work in. Theoretical exposure frameworks compound this by relying on what AI models could potentially do, rather than what is actually deployed and operational in workplaces. Tasks like authorizing drug refills score as theoretically automatable but are rarely observed as automated in practice, creating inflated occupational exposure rankings that don’t match real conditions.
No standardized definitions currently exist for AI exposure, usage, or adoption across research programs. This absence of consensus means study findings vary significantly depending on classification choices. Occupation-level aggregates diverge sharply from usage-weighted observed exposure metrics, making cross-study comparisons unreliable without careful attention to methodology. Organizations building workforce strategy on a single metric risk working from a distorted baseline.
Uncertainty in causal interpretation: Correlation vs. actual displacement
Exposure metrics correlate with certain labor market signals, including slower hiring, reduced entry-level openings in exposed fields, and younger workers struggling to find initial placement. But they correlate weakly and inconsistently with broad employment or unemployment outcomes. No systematic AI-driven unemployment rise appears in current data, even as exposure scores for many occupations have climbed substantially. This matters because it limits the strength of causal claims. An occupation’s high exposure score reflects a structural characteristic, not a proven outcome. Analysts also need to account for “narrator’s bias,” the tendency for researchers who work in high-cognitive, high-exposure roles themselves to interpret AI risks more dramatically than historical automation research might warrant.
Gaps in measuring human-AI collaborative work
Perhaps the most significant methodological gap involves collaborative human-AI work. Observed exposure frameworks do weight automated patterns more heavily, but they still struggle to capture productivity and quality dynamics in roles where humans and AI tools work together fluidly. Two-thirds of affected jobs involve partial change rather than wholesale automation, meaning the more common future state is a human worker augmented by AI tools handling routine elements of the role. Exposure metrics tend to frame this as a displacement story rather than a restructuring story, and that framing shapes how organizations respond. Measuring the judgment, creativity, and oversight functions that remain human is a frontier that current frameworks have not yet solved.
Using workforce exposure data to inform strategic decisions
Exposure data becomes valuable when it drives action. The organizations pulling ahead in workforce readiness are those translating measured risk into specific, targeted interventions rather than waiting for broad labor market signals to arrive.
How employers can apply exposure metrics to workforce planning
Despite accelerating AI deployment, a significant execution gap persists. 83% of organizations with 5,000+ employees have deployed AI as of Q1 2026, up from 55% in 2024, yet a Pew Research Center October 2025 survey found that while 91% of organizations report using AI tools, only 21% of workers actually use AI at work. Reskilling intentions are similarly misaligned: 77% of employers plan to reskill workers for AI between 2025 and 2030, but only 13% of employees have received AI training. These gaps reflect a structural failure in how organizations convert exposure awareness into workforce action.
The most effective employer application of AI exposure data starts at the role and individual level, not the occupational level. Mapping task structures within specific job functions, rather than relying on occupational codes, gives workforce planners a more accurate view of where AI tools will genuinely reduce demand for current capabilities and where they will augment or restructure work. Pairing exposure scores with adaptive capacity data then allows organizations to distinguish between workers who need modest reskilling support and those facing genuine transition risk requiring more intensive investment. The challenge is not data availability but the analytical infrastructure to connect it: publicly documented organizational case studies applying these frameworks remain sparse, which itself signals how early most employers are in translating research-grade exposure metrics into operational planning.
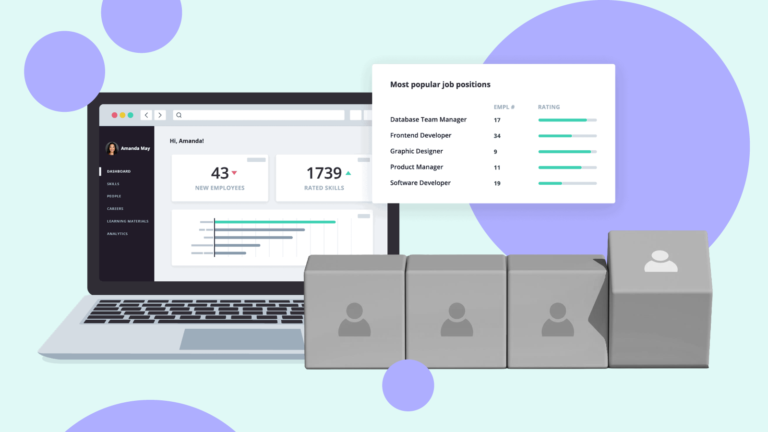
SkillPanel’s approach operationalizes this process end to end. Its AI exposure framework assesses employee readiness across skills, perception, and willingness, then combines that data with role-level AI risk to generate workforce transformation paths, upskilling actions, and dynamic headcount projections. Rather than producing static reports that managers interpret individually, the platform delivers system-guided actions continuously updated as workforce conditions shift.
How policymakers are using exposure indexes to prioritize support programs
At the policy level, exposure indexes are reshaping how workforce development investments get targeted. The geographic and demographic concentration of vulnerable workers, particularly the 6.1 million in high-exposure, low-adaptive-capacity roles, provides a defensible basis for prioritizing regions like smaller state capitals and college towns over larger urban centers where adaptive capacity is naturally higher. Federal and state programs are beginning to use occupation-level exposure data combined with regional labor market analysis to identify where retraining investments have the highest social return. The IMF’s finding that AI skills correlate with reduced entry-level hiring in automatable tasks also points policymakers toward early intervention in workforce entry pipelines, particularly for younger workers entering administrative or clerical career tracks.
Translating exposure data into upskilling and transition investments
The final and most consequential step is turning exposure analysis into learning and transition investment. This is where many organizations currently stall, unable to move from “we know these roles are exposed” to “here is what we’re doing about it for these specific workers.” Effective translation requires granular data on individual skill profiles, not just role categories. It requires understanding where skills gaps exist relative to adjacent, growing roles. And it requires a continuous feedback loop, not a once-annual assessment.
SkillPanel’s AI-generated skill profiles are built from multiple data sources and automatically detect gaps against target skill states, generating personalized learning pathways that scale across a workforce. The platform’s workforce skills maps provide interactive, real-time visualization that benchmarks employees against industry standards and forecasts skills erosion from automation, with research suggesting 44% of essential skills could be disrupted within three years. The AI-powered skills gap analysis component automatically infers skills from multiple data sources, benchmarks workers against market standards in real time, and prioritizes development areas by their direct impact on AI readiness strategy. By identifying which workers face the steepest adaptation curves and generating targeted transformation paths rather than generic training programs, organizations can prioritize upskilling investment where it creates the most resilience before displacement becomes a crisis.